Tectonic plate
Antarctic Plate
A major plate carrying Antarctica and a wide surround of ocean floor. It is unusual in being almost entirely ringed by spreading centres, so that it grows on nearly every side and subducts along almost none.
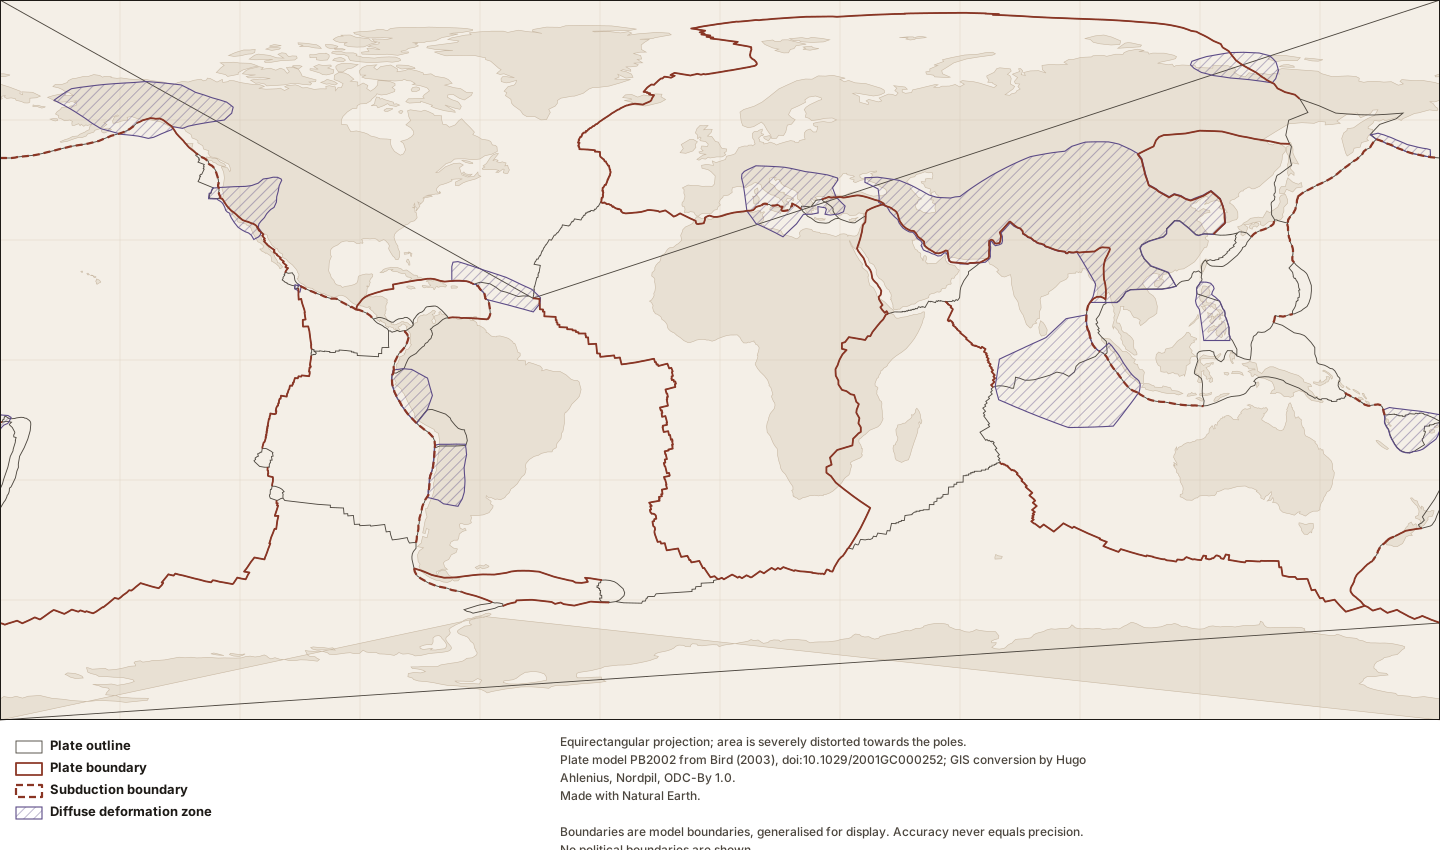
Figure by Lithoen. Plate model PB2002 from Bird (2003), doi:10.1029/2001GC000252; GIS conversion by Hugo Ahlenius, Nordpil, ODC-By 1.0. Made with Natural Earth. Underlying data remain under their own licences. · LITHOEN-ORIGINAL · Derivative: Generated from published Lithoen spatial records by scripts/generate-maps.ts; no coordinate was edited by hand. Features spanning ±180° are split for rendering only; the stored geometry is unchanged.
Classification
- plate class
- major
How this is mapped
5 published representations of where Antarctic Plate is. Each is one interpretation, by one identified source, at one scale — not the shape of the thing itself.
Tectonic model geometry
Polygon · 388 positionspreferred for publicationGeometry that exists because a model defines it — a rigid-plate outline, a zone where a model declares itself inapplicable. It is a property of the model, and changes when the model is revised. It is present-day geometry from a present-day model; a palaeogeographic reconstruction is a different thing and Lithoen does not hold one.
The Antarctic Plate as outlined in model PB2002 (Bird, 2003). This is the model’s boundary, not a mapped geological contact: it is where a rigid-plate model puts the edge of a plate, and Bird’s own documentation states that coordinates are given to a precision of about 60 m while "accuracy never equals precision". Where deformation is distributed rather than confined to a line, the model marks the region as an orogen and the outline there is a convenience.
- Boundary certainty
- InterpretedThe boundary was placed by a geologist reading evidence: mapping, geophysics, geochronology, structure. It is reproducible from that evidence and it is an interpretation of it. Most geological boundaries are this.
- Status of this geometry
- modelledThe status of the geometry, which need not match the status of what the entity’s claims assert.
- Dataset
- PB2002 plates, boundaries and orogens as GeoJSON (fraxen/tectonicplates)Plate model PB2002 from Bird (2003), doi:10.1029/2001GC000252; GIS conversion by Hugo Ahlenius, Nordpil, ODC-By 1.0.
What was done to this geometry
- By Lithoen — Douglas–Peucker, 746 positions to 388
- By Lithoen — Coordinates rounded to 4 decimal places, about 11 m of longitude at the equator.
- Before it reached Lithoen — Bird (2003) digitised the boundary curves from published sources at varying scales; the model is a compilation, not a single survey.
- Before it reached Lithoen — The GIS conversion (Ahlenius, ODC-By 1.0) split segments spanning the -180/180 meridian and moved them, as its README states. Four plates therefore arrive as multi-part geometries.
Boundary
MultiLineString · 209 positionsA line delimiting or separating things — a plate boundary, a suture, a mapped contact. A boundary is not an extent: it says where the edge runs, not what lies on either side.
Antarctic–Australian boundary as drawn in model PB2002 (Bird, 2003), from source segments AU-AN. The Southeast Indian Ridge, a long intermediate-rate spreading centre in the Southern Ocean. The model applies no class to these segments. Bird states that a single class cannot always be specified for an entire boundary curve, or even for an entire segment, because the class changes with local changes in azimuth — so Lithoen classifies no further than the source does. Digitised by: Mueller et al. [1987]; by Peter Bird, October 2001.
- Boundary certainty
- InterpretedThe boundary was placed by a geologist reading evidence: mapping, geophysics, geochronology, structure. It is reproducible from that evidence and it is an interpretation of it. Most geological boundaries are this.
- Status of this geometry
- modelledThe status of the geometry, which need not match the status of what the entity’s claims assert.
- Dataset
- PB2002 plates, boundaries and orogens as GeoJSON (fraxen/tectonicplates)Plate model PB2002 from Bird (2003), doi:10.1029/2001GC000252; GIS conversion by Hugo Ahlenius, Nordpil, ODC-By 1.0.
What was done to this geometry
- By Lithoen — 3 source features carrying the same identifier were combined into one multi-part geometry; no coordinate was altered by the combination.
- By Lithoen — Coordinates rounded to 4 decimal places, about 11 m of longitude at the equator.
- Before it reached Lithoen — Bird (2003) compiled these curves from published sources at varying scales, crediting each segment to its own source; those credits are carried in the caption of every record.
- Before it reached Lithoen — The GIS conversion (Ahlenius, ODC-By 1.0) split segments spanning the -180/180 meridian and moved them, as its README states.
Boundary
MultiLineString · 302 positionsA line delimiting or separating things — a plate boundary, a suture, a mapped contact. A boundary is not an extent: it says where the edge runs, not what lies on either side.
Antarctic–Pacific boundary as drawn in model PB2002 (Bird, 2003), from source segments PA-AN. The Pacific–Antarctic Ridge, the southern continuation of the East Pacific Rise. The model applies no class to these segments. Bird states that a single class cannot always be specified for an entire boundary curve, or even for an entire segment, because the class changes with local changes in azimuth — so Lithoen classifies no further than the source does. Digitised by: Mueller et al. [1987].
- Boundary certainty
- InterpretedThe boundary was placed by a geologist reading evidence: mapping, geophysics, geochronology, structure. It is reproducible from that evidence and it is an interpretation of it. Most geological boundaries are this.
- Status of this geometry
- modelledThe status of the geometry, which need not match the status of what the entity’s claims assert.
- Dataset
- PB2002 plates, boundaries and orogens as GeoJSON (fraxen/tectonicplates)Plate model PB2002 from Bird (2003), doi:10.1029/2001GC000252; GIS conversion by Hugo Ahlenius, Nordpil, ODC-By 1.0.
What was done to this geometry
- By Lithoen — 3 source features carrying the same identifier were combined into one multi-part geometry; no coordinate was altered by the combination.
- By Lithoen — Coordinates rounded to 4 decimal places, about 11 m of longitude at the equator.
- Before it reached Lithoen — Bird (2003) compiled these curves from published sources at varying scales, crediting each segment to its own source; those credits are carried in the caption of every record.
- Before it reached Lithoen — The GIS conversion (Ahlenius, ODC-By 1.0) split segments spanning the -180/180 meridian and moved them, as its README states.
Boundary
MultiLineString · 34 positionsA line delimiting or separating things — a plate boundary, a suture, a mapped contact. A boundary is not an extent: it says where the edge runs, not what lies on either side.
Antarctic–Scotia boundary as drawn in model PB2002 (Bird, 2003), from source segments SC-AN. The South Sandwich subduction zone and the transform systems that bound the small Scotia Plate. The model applies no class to these segments. Bird states that a single class cannot always be specified for an entire boundary curve, or even for an entire segment, because the class changes with local changes in azimuth — so Lithoen classifies no further than the source does. The segments of this plate pair are split across two records because the source labels part of it subduction and part of it unclassified; merging them would have asserted one class for the whole. Digitised by: Klepeis and Lawver, 1996; Leat et al. [2000]; Maldonado et al., 1998.
- Boundary certainty
- InterpretedThe boundary was placed by a geologist reading evidence: mapping, geophysics, geochronology, structure. It is reproducible from that evidence and it is an interpretation of it. Most geological boundaries are this.
- Status of this geometry
- modelledThe status of the geometry, which need not match the status of what the entity’s claims assert.
- Dataset
- PB2002 plates, boundaries and orogens as GeoJSON (fraxen/tectonicplates)Plate model PB2002 from Bird (2003), doi:10.1029/2001GC000252; GIS conversion by Hugo Ahlenius, Nordpil, ODC-By 1.0.
What was done to this geometry
- By Lithoen — 4 source features carrying the same identifier were combined into one multi-part geometry; no coordinate was altered by the combination.
- By Lithoen — Coordinates rounded to 4 decimal places, about 11 m of longitude at the equator.
- Before it reached Lithoen — Bird (2003) compiled these curves from published sources at varying scales, crediting each segment to its own source; those credits are carried in the caption of every record.
- Before it reached Lithoen — The GIS conversion (Ahlenius, ODC-By 1.0) split segments spanning the -180/180 meridian and moved them, as its README states.
Boundary
LineString · 17 positionsA line delimiting or separating things — a plate boundary, a suture, a mapped contact. A boundary is not an extent: it says where the edge runs, not what lies on either side.
Antarctic–Scotia boundary as drawn in model PB2002 (Bird, 2003), from source segments SC/AN. The South Sandwich subduction zone and the transform systems that bound the small Scotia Plate. The model labels these segments as subduction. The segments of this plate pair are split across two records because the source labels part of it subduction and part of it unclassified; merging them would have asserted one class for the whole. Digitised by: Klepeis and Lawver, 1996.
- Boundary certainty
- InterpretedThe boundary was placed by a geologist reading evidence: mapping, geophysics, geochronology, structure. It is reproducible from that evidence and it is an interpretation of it. Most geological boundaries are this.
- Status of this geometry
- modelledThe status of the geometry, which need not match the status of what the entity’s claims assert.
- Dataset
- PB2002 plates, boundaries and orogens as GeoJSON (fraxen/tectonicplates)Plate model PB2002 from Bird (2003), doi:10.1029/2001GC000252; GIS conversion by Hugo Ahlenius, Nordpil, ODC-By 1.0.
What was done to this geometry
- By Lithoen — Coordinates rounded to 4 decimal places, about 11 m of longitude at the equator.
- Before it reached Lithoen — Bird (2003) compiled these curves from published sources at varying scales, crediting each segment to its own source; those credits are carried in the caption of every record.
- Before it reached Lithoen — The GIS conversion (Ahlenius, ODC-By 1.0) split segments spanning the -180/180 meridian and moved them, as its README states.
In the knowledge graph
- Antarctic Plate adjacent to African Plate
- Antarctic Plate adjacent to Australian Plate
- Antarctic Plate adjacent to Pacific Plate
- Antarctic Plate adjacent to Scotia Plate
Record last updated 2026-09-07. Corrections follow the published corrections policy; superseded claims are retained, never silently edited.